 THE GROWING WORLD OF DAHLIAS
![]()
|
The objective was to determine if the dates when seedlings produced their first
flowers varied from one seed parent to another. It seemed logical that the
majority of the first flowers would appear over a fairly short period of perhaps
a week or ten days and that this maximum appearance �bulge� could vary from one
seed parent to another.
In previous years I found that plants in their first full year of growth varied
in the dates they produced their best flush of flowers, after applying my
standard procedure of double stopping (at eleven weeks then seven weeks before
the NDS National Show). So some did not make the top shows because the main
flush fell before or after the show dates.
Could the information obtained as suggested above be used to calculate optimum
stopping dates and facilitate main flushes occurring on the BIG show date?
So the date each first flower reached maturity was recorded as can be seen on
the data sheet.
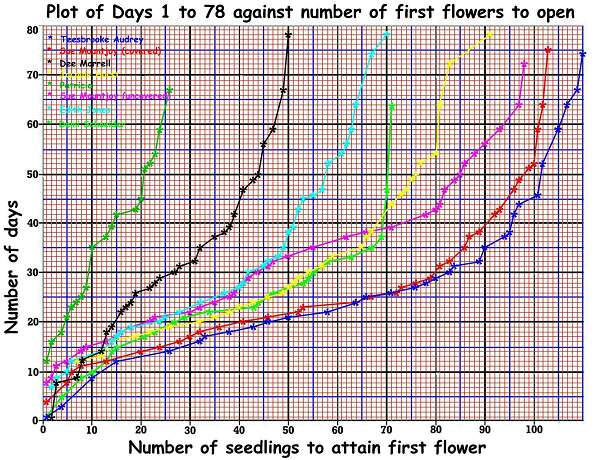
The crude data was plotted as shown below. The �x� axis depicts the number of
first flowers as they accumulated. The �y� axis is the number of days starting
from the first date a �first flower� was recorded (13th July � Day 1) to the
last day �first flowers� were recorded (29th September � Day 78).
Little can be deduced from this as the main differences occur because of the
discrepancy between the number of plants of each seed parent grown.
To normalise these data so that the dates when first flowers appeared could
apply equally to all the seedlings, the �x� axis was defined as the percentage
of the final total of first flowers. The resulting graph is shown below.
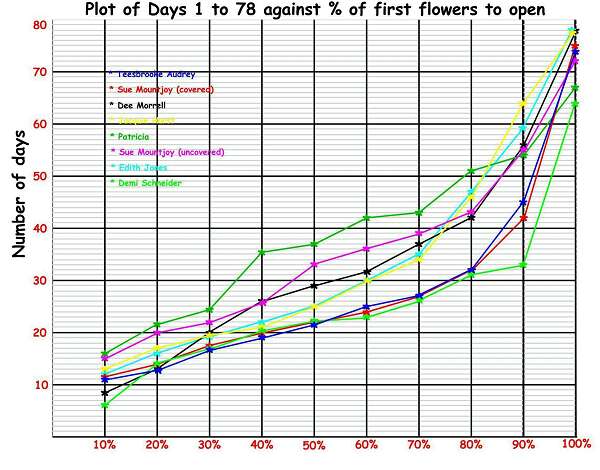
The most obvious observation is the absence of the expected �bulge� � a short
period when most of the �first flowers� would appear. The implication is that
the rate of first flowers appearing was constant for 10% to 80% of all the seed
parent�s seedlings. In fact the standard deviation from a straight line in all
cases was close. The slopes of the plotted lines indicate the different rates at
which first flowers appeared.
The maximum difference between the eight seed sources was 10 days at 10% of
first flowers rising steadily to 20 days at 80%.
So the conclusions are firstly that the rate of first flowers appearing is
constant for 70% of the total thus negating the supposition of a peak in
appearance of first flowers. Secondly, seedling�s first flowers from the eight
seed parents vary progressively by ten to twenty days for 70% of the total.
There is a detectable difference between the dates of first flowers opening for
the two sets of SUE MOUNTJOY. This was four days at 10% and increased steadily
to 11 days at 80% of the total first flowers. No reason for this difference can
be suggested, but it could well indicate that the concept linking �first flower�
opening dates to peak flush of flowers dates is anomalous. Ah well, another
research cul-de-sac!